|
|
There are two 1D view ports in SpecMan4EPR. First one is always visible. Second can be switched on and off and shows selected data. One can use sliders in the right part to switch between 1D slices. The primary dimension of the view port can be specified. Only one data trace from experiment can be shown at a time. 1D Viewer Settings dialog has number of view ports settings. The default state of view port in Run mode can be set in the Actions dialog.
|
Data selector |
First view port can have up to two experiments shown at a time. Second view port can show four experiments at a time. |
|
Zoom mode selector |
Switch on / off on-screen rescale of all traces. |
|
Visual buffer. |
Run time only. Dynamic buffer that represents data accumulated on the first experiment axis. |
|
Scan buffer. |
Run time only. Dynamic buffer that represents data accumulated on the last experiment axis. After the end of the scan this buffer is added to main storage. For experiments with one axis only scan buffer is identical to visual buffer. |
|
Continuous scan buffer |
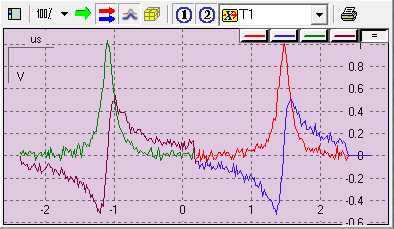
Run time only. Shows scan buffer for all scans. Allows to observe differences between scans. Buffer is updated with the update rate of server. If scans of experiment are generated faster than the server update rate, some data might be skipped. Continuous scan buffer traces appear on the left from other traces (see green and violet traces on the screen shot above). |
|
Main storage. |
Represents data of experiment. Empty during the first scan. |
|
Experiment streams |
Up to six streams of the experiments. For typical experiment first stream represents 'real' part of data and second stream represents 'imaginary' part. |
|
Selector of primary axis |
Selects abscissa of the multidimensional data. |
|
Print view port |
Print view port. Print settings can be found in Options dialog. |
|
Trace selector |
Left click to select trace for individual trace scaling. Right click for pop-up menu and trace information. |
|
Plot options |
Left click to select all traces for scaling. Right click for plot options pop-up menu. Pop-up menu: Common scale - return to common scale of traces. Full scale - the best scale to see all data. Show hint - hint that shows the plot coordinates under the cursor. Allow options - restrictions on scale modifications. See Options dialog for default settings. |
Mouse actions
|
Left mouse button and drag |
Zoom |
|
Right mouse button and drag |
Scale proportionally to the distance from initial point |
|
Middle mouse button and drag |
Shift |
| Left mouse button double click |
Return to the best scale |
| Right mouse button click |
Zoom out factor of 2 |
|
Control button |
Prevent changing of X dimension |
|
Shift button |
Prevent changing of Y dimension |
|
Alt button and left mouse button |
Distance measurement |
|