|
|
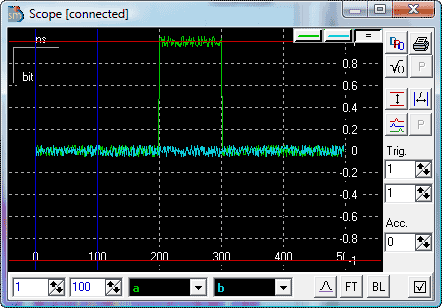
Scope window shows transient signals and can
be used for the setup of the echo integration and baseline
approximation ranges.

|
To see the help click on the corresponding control. |
|
Scope window |
Data traces are shown in the 'Scope
window'. There are three types of cursor that can be visible in
the window: maximum and minimum data values (by default colored red),
integration window (by default colored blue) and two base line approximation
regions (by default colored magenta). Color settings of the window are
located in the Options dialog.
For more information on window manipulations such as rescaling
etc, see help on View Port. |
 |
Trace selector. Left click to select trace for individual trace scaling. Right click for pop-up menu and trace information. |
 |
Plot options. Left click to select all traces for scaling. Right click for plot options pop-up menu. Pop-up menu: Common scale - return to common scale of traces. Full scale - the best scale to see all data. Show hint - hint that shows the plot coordinates under the cursor. Allow options - restrictions on scale modifications. See Options dialog for default settings. |
|
Integration Window
Controls |
When transient axis of the experiment is
set to the integration mode ( ) SpecMan4EPR automatically integrates time
traces. The range of integration can be specified with the
'Integration Window Controls'. The integration window appears on
the scope as a vertical lines (blue color by default). Only the
part of the trace between these lines is integrated. Information
about the integration window is stored in the experiment file. ) SpecMan4EPR automatically integrates time
traces. The range of integration can be specified with the
'Integration Window Controls'. The integration window appears on
the scope as a vertical lines (blue color by default). Only the
part of the trace between these lines is integrated. Information
about the integration window is stored in the experiment file. |
|
Scope Channel Selectors |
Scope can show up to two time traces
at a time. Use Scope Channel Selectors to choose traces of
interest. Names of all data acquisition streams can be found in
the Selector's combo box. |
|
Trace Processing |
Additional processing that can be applied to the underlying or visualized data. When one of the processing selected corresponding panel will be open at the bottom of the scope window. |
 |
Signal traces subjected to reproducible
low-frequency aperiodic noise (caused by setup warming, standing
waves etc) can be very effectively corrected by subtracting the
baseline (see also random acquisition). When this option is selected REAL data are corrected. Two intervals can be used to select data area used for baseline sampling. Using of baseline correction in normal cases is not
advisable.
 |
| FT |
Complex Fourier transformation of data traces. Two traces should be selected. Data are not modified. For baseline determination last 100 points of data trace are used.
 . . |
| BL |
Baseline subtraction. The trace that has no data can be stored into memory and then be subtracted from the current trace. To store the trace as a baseline, first Reset baseline should be pressed and only then Store baseline button. Otherwise the correction will be cumulative for all previous baseline stored.
 . . |
|

|
Additional options panel toggle button. |
|
Additional options panel |
Additional options. |
|

|
Toggle off clearing of the screen from previous traces. |

|
Print scope window |

|
Toggle absolute value trace. Two data traces should be selected. |

|
Acquisition devices typically have the
range of acceptable input values. Exceeding of these values can
possibly cause the distortion of the signal. Thus it is advisable
to keep the signal within the safe region. Safe region visualized
as a horizontal bars (red color by default) and can be
defined in the Options dialog. |

|
Re-scales the scope to show the full range of
the signals. |

|
Automatic separation of traces. Not working. |
|
Trace parameters |
Trigger number for first and second traces and number of trace averages. |
|