|
|
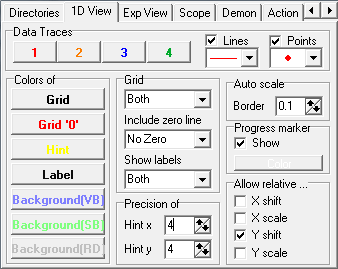
This dialog tunes the appearance of the main and secondary Viewports.
|
- Data Traces set the color and drawing stiles of all Viewport traces.
- Colors set colors of Viewport elements. The background of the Viewport is dependent on the selected view type.
- Grid enables the on screen grid. Zero line option force viewport to change data view range so that zero line is visible. Show labels options add labels on axis.
- The precision of hints affects the information displayed in data hints.
- The border of Auto scale option increases the displayed data range.
- The progress marker is a vertical cursor that selects the last acquired point in the trace. It visualizes of the experiment progress.
- Allow relative enables certain transformation of displayed data range in manual mode.
|
|